Some of the most notable and least understood being the ability to see trade flags.
Let’s talk about the mythical cross trade and see if we can deduce anything from it.
The team at UW released a dive into floor trades, so naturally that got me thinking.
What is a floor trade? Well, a floor trade is made on an actual trading floor of the exchange by a person actually submitting a trade. Since that is their specific job, you’d think that they’d have a higher winrate, right?
Well, you can find out by reading the blog.
https://unusualwhales.com/blog/floor-traders-weekly-call-options
There is another layer to flags that the tool can catch: cross trades.
But what are cross trades?
A cross trade is when separate clients within the same broker execute buy/sell orders for the same security at a fair market price, and happen fairly frequently within options trading.
Most exchanges do not allow this and deem it illegal, however, there are some exceptions.
1) When the buyer and sell are managed by the same asset manager (broker, in capacity)
2) The price of the cross trade is considered as competitive to the market at the time the trade is executed.
3) The big one: hedging derivatives trades
The broker is required to show the exchange involved that the trade was beneficial to both parties. However, is there a situation where the broker would take a loss on a cross trade for a higher potential profit in the future? Perhaps.
If the buyer/seller both benefit from the trade and buy/sell at their fair price, the broker could potentially be taking a willing hit on this, but could point to an increase in profit in the future.
This loops back in
>hedging derivatives trades
If the brokers take a hit on the derivatives knowing their held shares might make up for that loss, probabilistically, then maybe there is a signal garnered there.
Can we know this for sure? Not really, but it’ll require more digging.
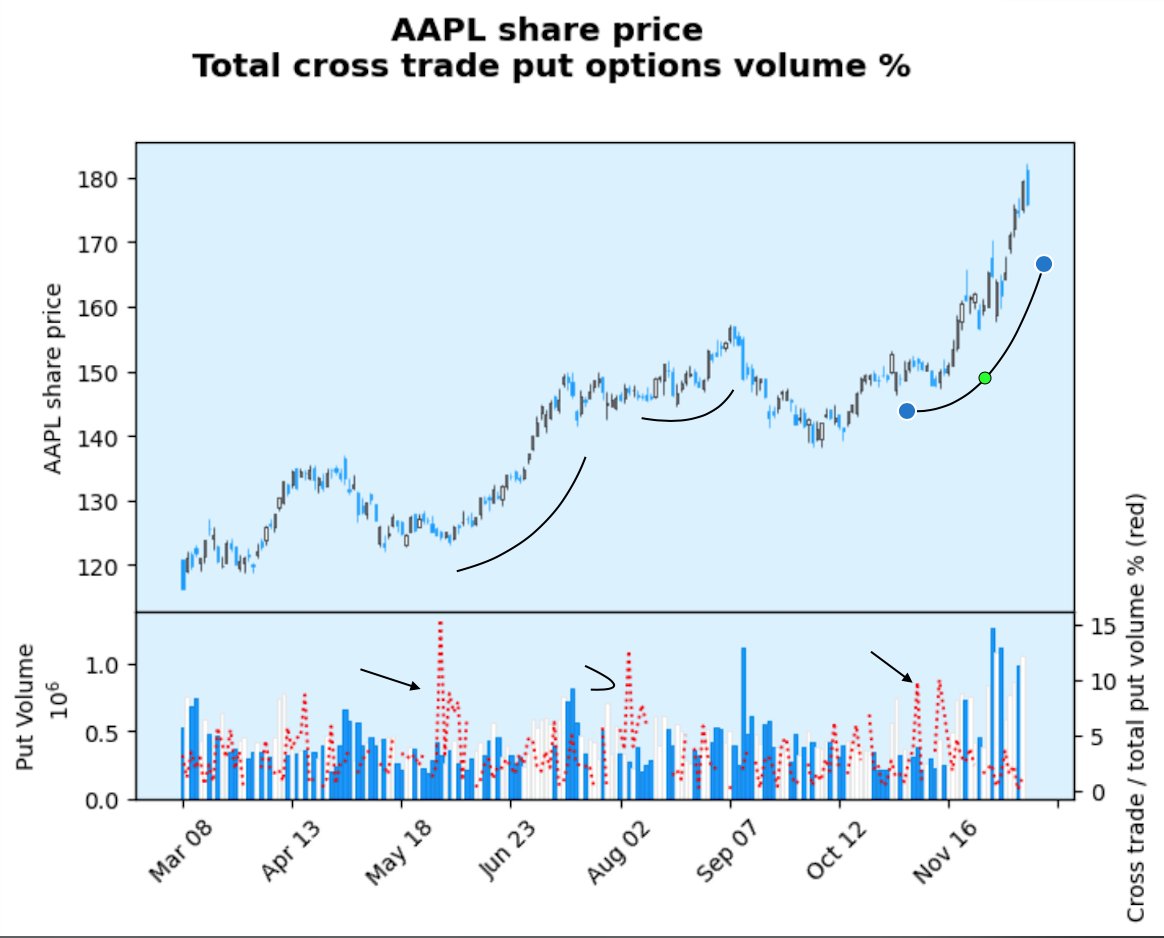
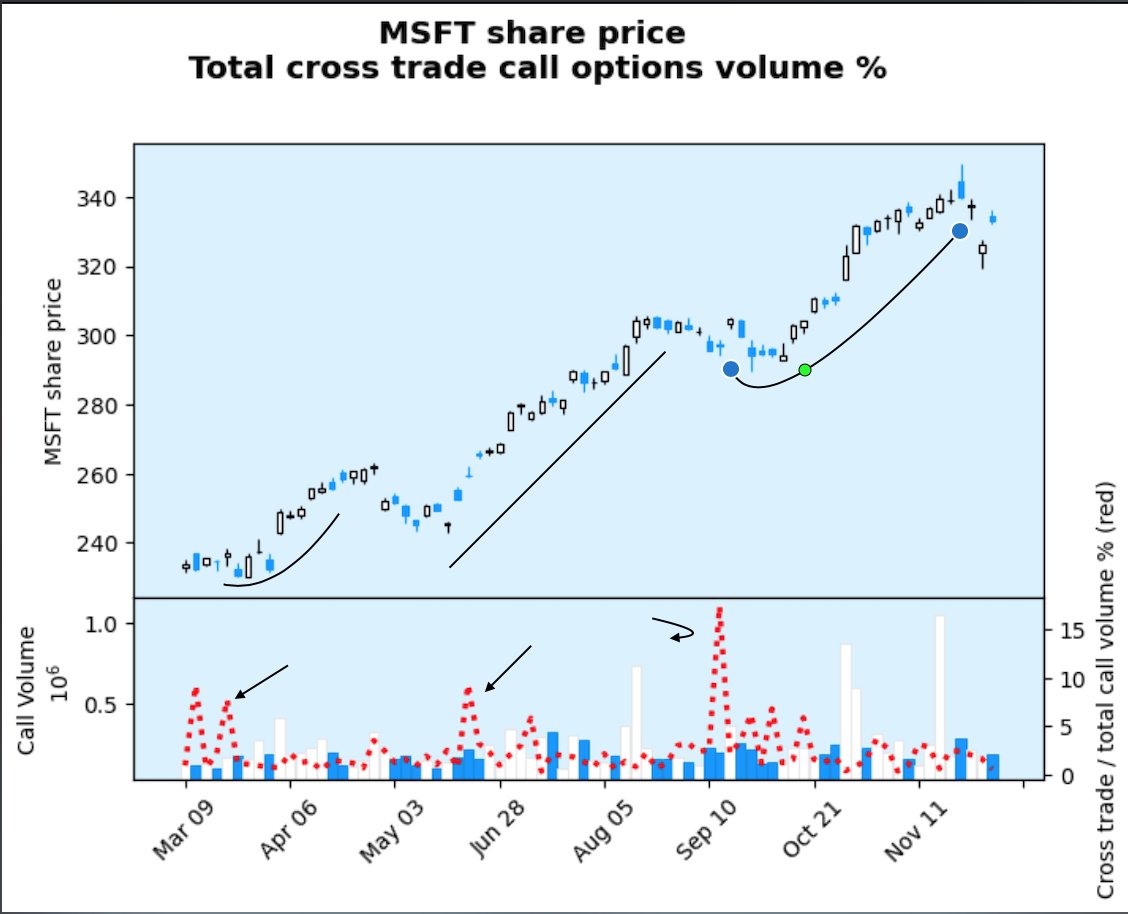
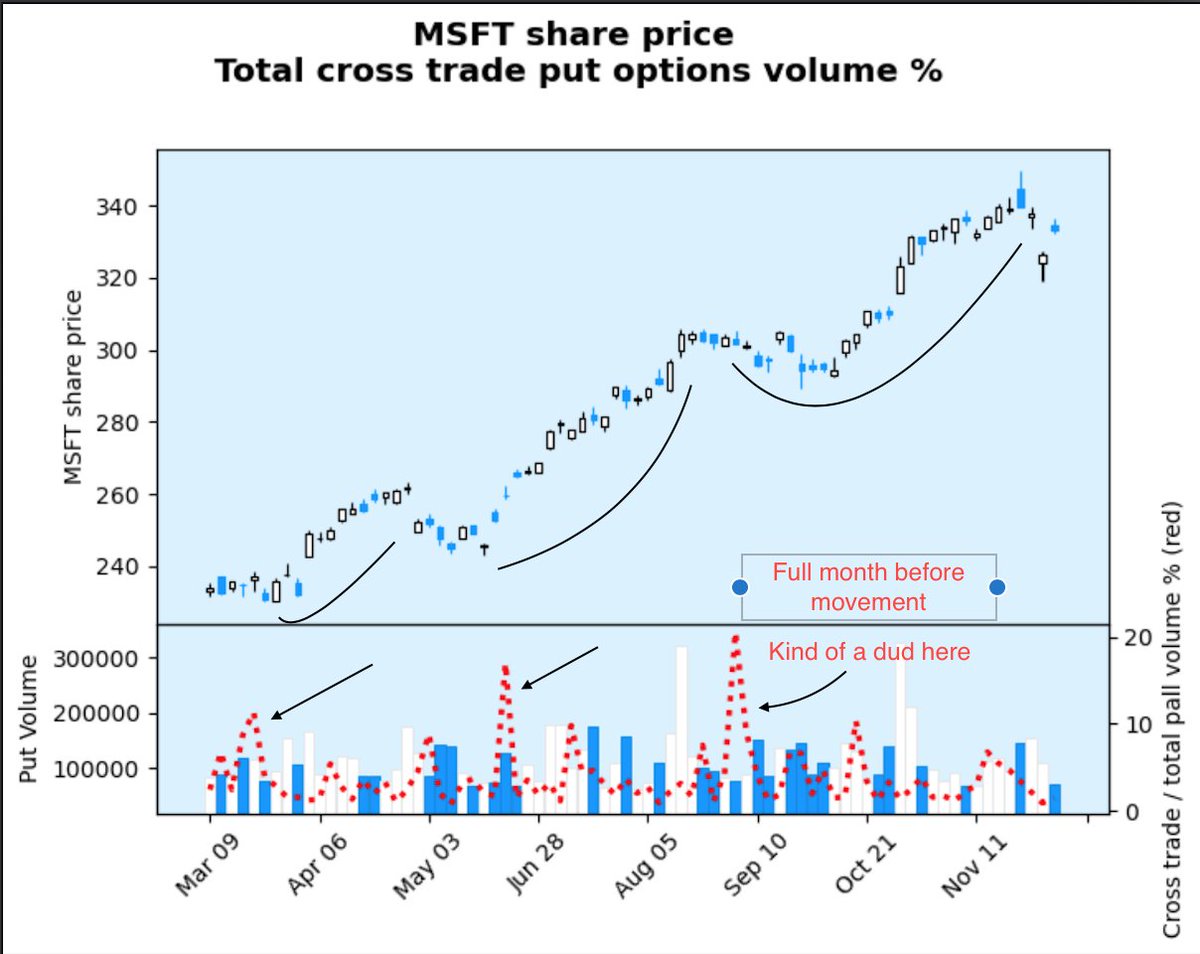
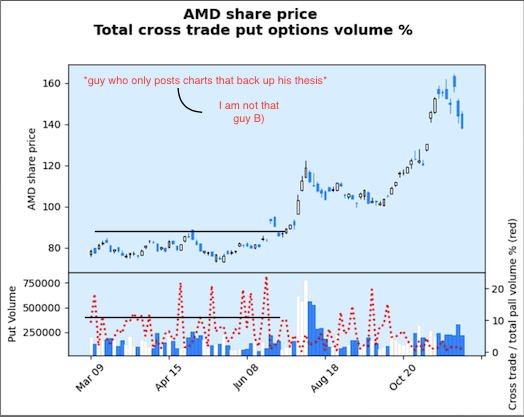
I took a look at a few different high volume tickers and created a cross trade ratio of total options volume to see if there was anything measurable. Here’s some visual results.
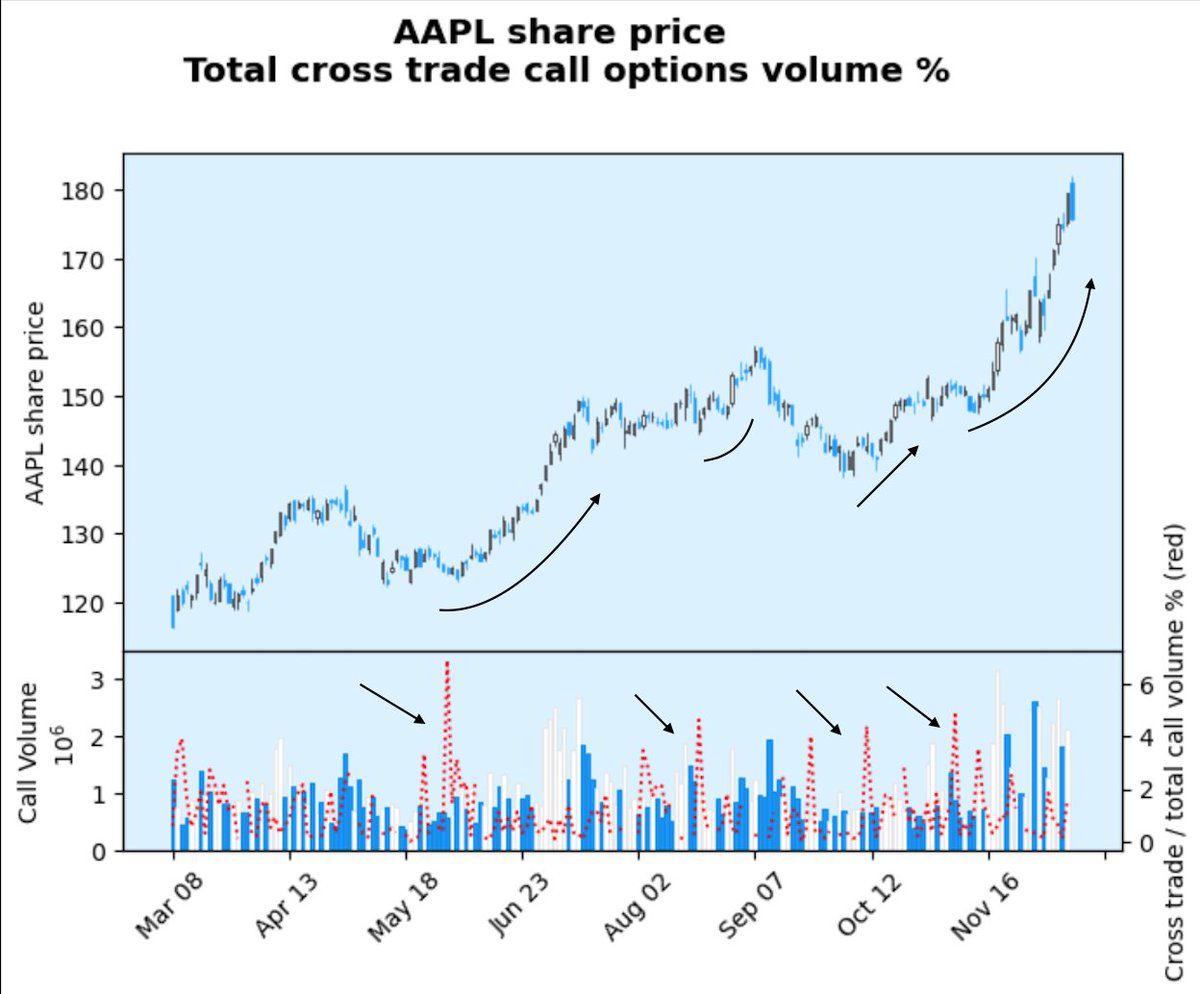
Some tickers are not as transparent as others. Some receive high % of cross trade total volume and don't move, such as the case here with AMD.
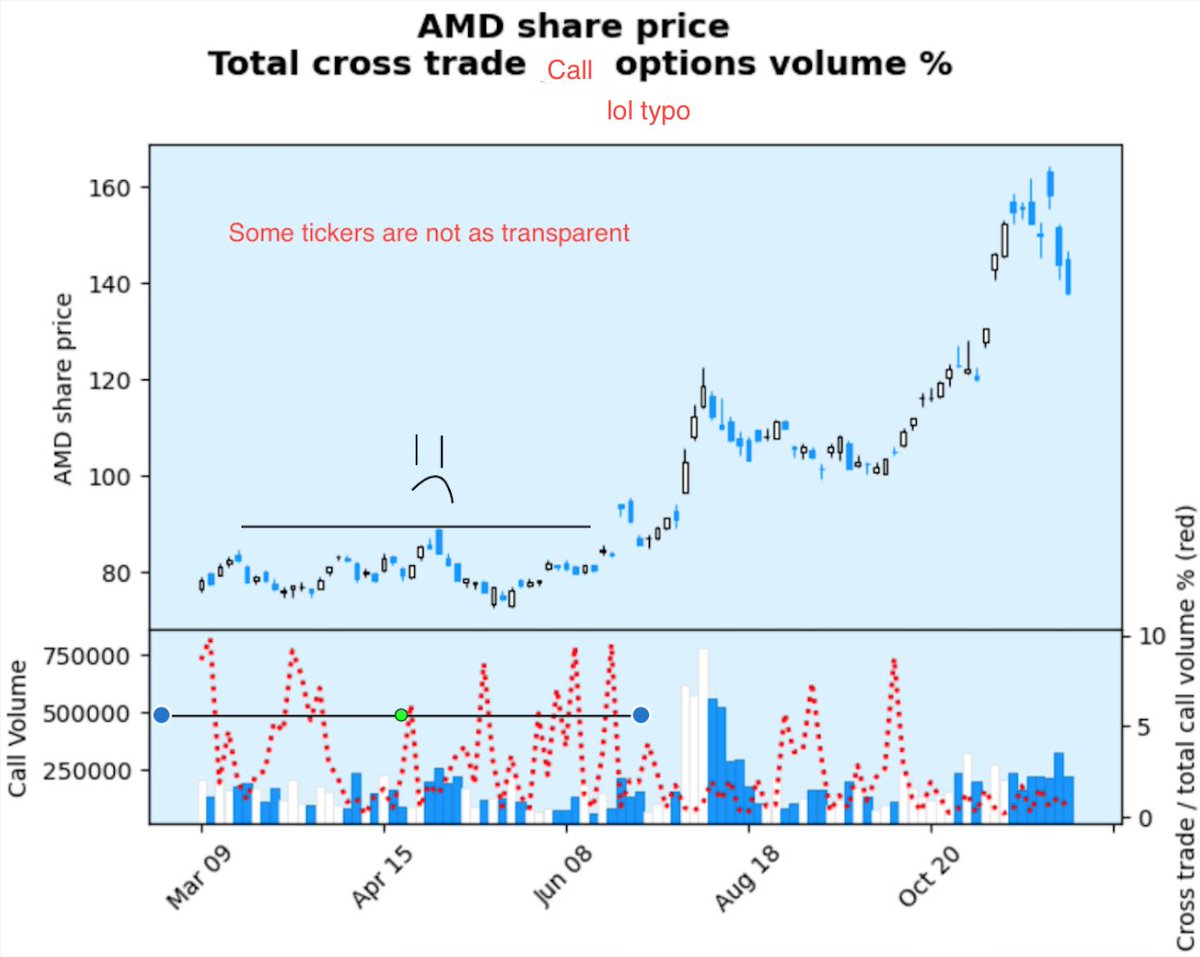
There’s nothing statistically grounding within these.
In fact, the correlation when ran throughout the whole dataset was nearly 0.
But there are signs that, albeit anecdotal observed evidence, might point to something deeper. Would need to adjust thresholding and check SD.
Why does this matter? Why do they happen? Well, it could be relaying increased buying/selling activity, bullish/bearish movement, or it could mean absolutely nothing. I don't really know yet. For now, though, I hope you learned something. If you have any questions, please feel free to dm me on twitter https://twitter.com/faclon_fintwit