FOMC meetings produce higher than normal premium spikes
SPX goes up following the meetings, on average
The pressure of interest rates continues to drive fear in the markets. Recently, the Federal Reserve raised interest rates 50 bps (basis points) to counteract the inflationary pressures affecting Americans. The market responded with a short rally intraday on May 4th, followed by ~4% decline in the S&P 500, 6% decline in the NASDAQ and ~3.5% decline in the Dow Jones throughout the session on May 5th.
AD_SHOULD_BE_HERE
This rate hike is the most aggressive of its kind since 2000, shortly before the dotcom bubble popped in 2001. Since then, the Federal Reserve has decided to only raise interest rates by 25 bps, so the severity of this 50 bps hike cannot be downplayed.
Rate hikes affect credit cards, mortgages, business loans, and everything else that involves continued payment for goods/services. Interest rate increases will be reflected in every facet of the economy, from gas prices to grocery items. For traders, rising interest rates typically means a move out of most long equities and into alternate investment vehicles, such as bonds and real estate, or value stocks, such as raw materials, credit companies, or cyclical defense stocks.
The FOMC meetings are where these discussions on the Federal Funds Rate take place, and traders across the country watch them religiously, especially in turbulent economic times following the COVID-19 Pandemic. FOMC meetings are held approximately 8 times a year, or loosely every 6 weeks, and interest rate adjustments are announced during the meeting, which usually causes some market turbulence. Traders hope to be a part of the winning side of the meeting with their trades, or catch the tailwinds of the direction of the market, but how can they predict the direction, and even if they get it right immediately after, what’s to make of the next day?
AD_SHOULD_BE_HERE
This report will look at how the FOMC meetings affect markets, and if there are any signs pointing to a direction prior to the event. If there are, how can we look at these in the flow?
FOMC Meetings Included in Analysis
I analyzed Unusual Whales options flow data between FOMC meetings from June 2021 to May 2022.
I have included links to the meeting notes on the Federal Reserve’s website for those curious in reading further, but here is the primer on the meetings.
Following the Fed’s aggressive buying in late 2021, the market selloff started in January as the Fed finished their tapering and started talks regarding rate hikes before the initial meeting date, along with Wall Street most likely catching wind before then.
However, retail traders don’t have the same access to information as the institutional players in the market, but Unusual Whales data gets them pretty close.
At Unusual Whales, we developed an indicator called the Cumulative Premium Options Effect (COPE). It measures the net premium inflows in the market. You can find this indicator on the Unusual Whales Intraday Analyst page.
AD_SHOULD_BE_HERE
Unusual Whales intraday analyst page overview
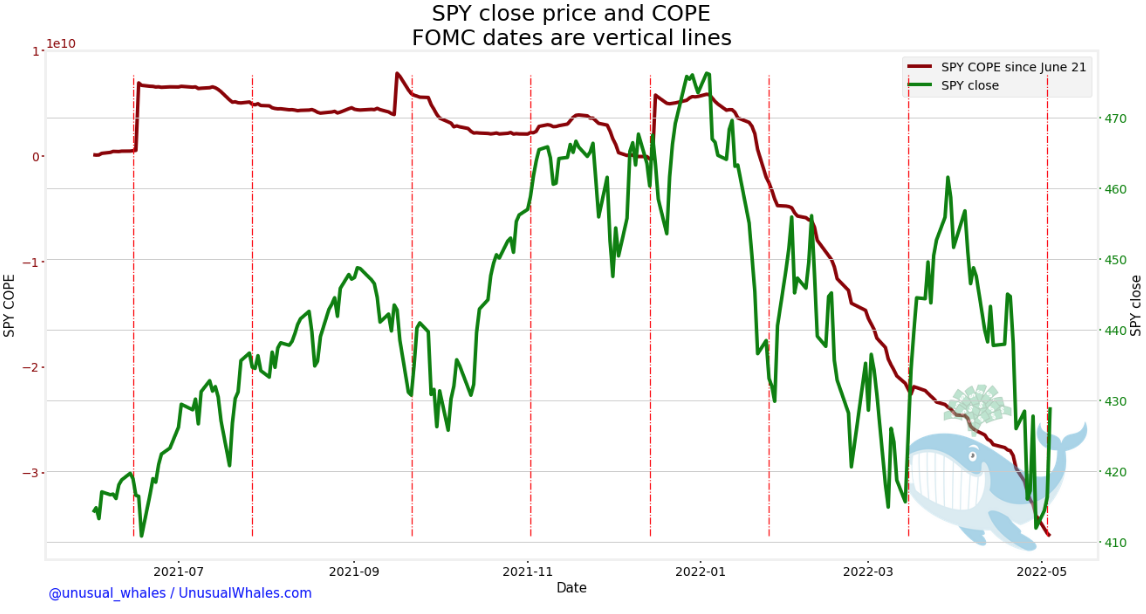
I calculated COPE starting from June 21, 2021 to determine what the movement of SPY’s options market was for the past year, approximately. COPE for this period was mostly bullish leaning until early January 2022, at which point the net premium started dropping and has been bearish since.
Cumulative Options Premium Effect over 11 month period
As for meeting dates, you can see large spikes in SPY net premium before and after the meetings themselves, eclipsing upwards of 6 times the average.
These spikes are potentially indicative of bullish activity in the near term, however, for 6 week cycles, they may not be reliable indicators. That being said, there are significant adjustments coming around FOMC meetings, but whether investors are bullish or bearish is left up to the FED’s decision on interest rates.
AD_SHOULD_BE_HERE
SPY 5 day rolling volume in relation to SPY close price over 11 month period
Volume spikes also corresponded with this change in premium. These periods of significantly higher volume coincide with movement around the FOMC meetings, especially in late 2021. This trend starts disappearing as we have rolled into a bear market, and more consistent put flows are seen after the first of the year as net volume trends downward.
SPY net premium and SPY close over 11 month period
It’s clear that the market responds to FOMC meetings, with volume, premium, and price fluctuation, however, are these moves readable to retail traders?
Let’s take a look.
AD_SHOULD_BE_HERE
SPY price up after meetings
The following charts show the percent change in SPY movement around FOMC meetings between June 2021 and May 2022. Percent changes on days before and after were calculated relative to the meeting date (Day 0).
Over 8 meeting samples, SPY falls an average of 0.87% 3 days prior to the meeting, and receives a healthy pump post meeting for an average gain of 1.73% 5-days after the meeting itself.
The session following the meeting, however, received the largest surge in share price for the period with a nearly 1% jump at close, followed with gradual gain up to that 1.73% level.
AD_SHOULD_BE_HERE
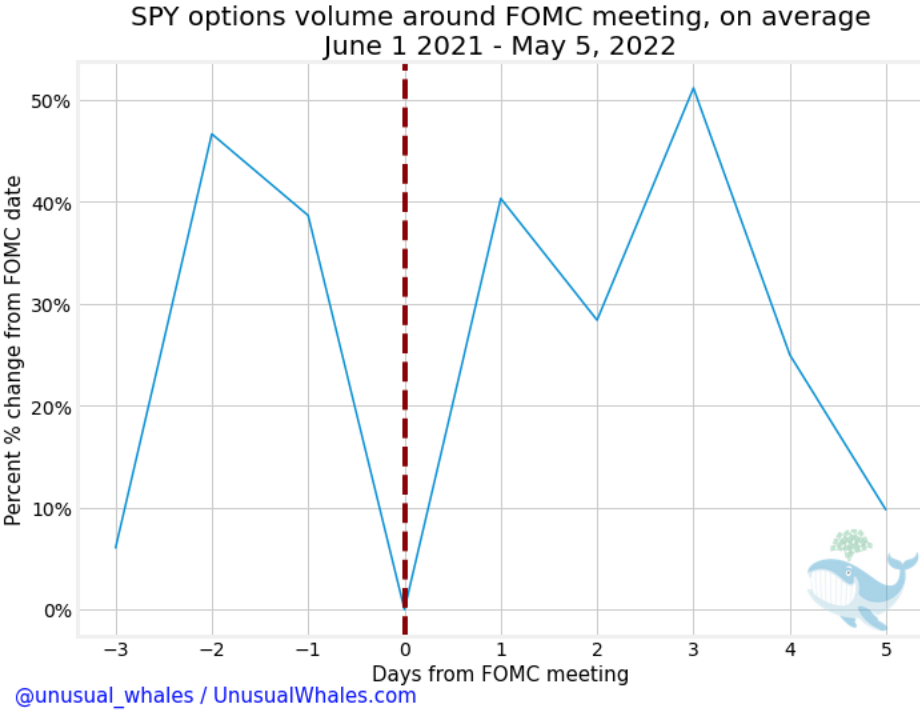
High SPY volume around meeting
Relative to the days before and after the meeting date, volume was lowest on the FOMC dates. Days before and after the meeting received upwards of 50% more volume than the meeting day itself. Significant activity around the meeting date shows indifference in direction between investors, as most big players are likely to start hedging based on their inclination.
SPY net premium spikes
Premium spikes around meeting day are not incredibly significant, short of 2 days post meeting where a 200% spike is seen. This 200% spike is attributed to two meetings in particular, June 15th, 2021 where the FED announced targets for rate hikes for 2022 and 2023, and December 14th, 2021 where the FED suggested they would start tapering their balance sheet more aggressively, and also alluded towards rate hikes come early 2022. However, the market selloff did not start until the near year, so the run for the rest of the year was most likely propped up on Christmas hopes and hedging effects bracing for rate hikes.
Follow the Flow
Looking at the Intraday Analyst Page on Unusual Whales, we can see the short term expiration receiving lots of bearish flow since February, with all flows except 2 months out following the trend.
AD_SHOULD_BE_HERE
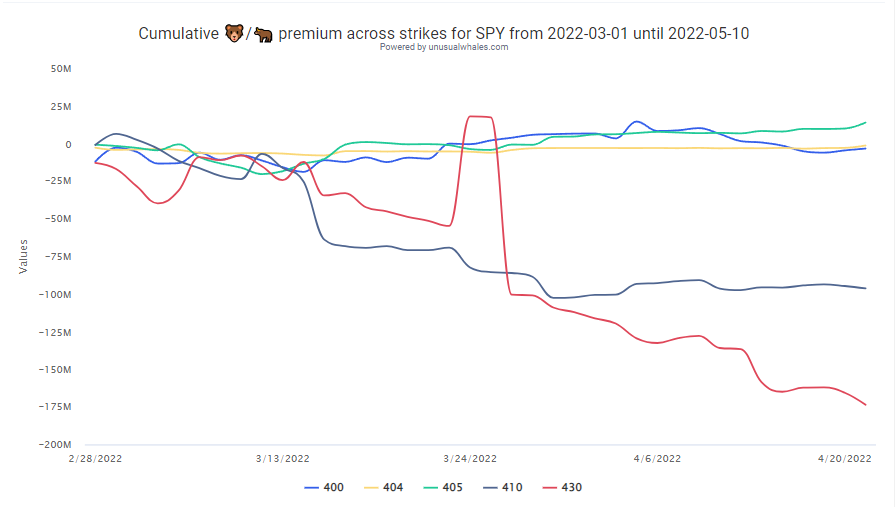
As far as levels, the 430 and 410 strikes received significantly more bearish premium throughout the period, perhaps foreshadowing the aggressive downward movement that has come to pass.
The period also sustained consistent bearish leaning flow. The majority of options traded were puts, and total ask vs bid side leaning 75% bid side, potentially suggesting a large amount of closed put positions. Premiums received largely bearish flow as well through the period. Click here to check out this page on the Unusual Whales website.
In the turbulent times of the 2022 bear market, which is driven off of these interest rate concerns, it is imperative to follow along to the results of these meetings, or try to hedge against results beforehand.
AD_SHOULD_BE_HERE
For the next meetings on June 14th, July 26th, and September 20th, the FED expects to continue raising interest rates, but according to FED Chairman Jerome Powell, he does not expect to raise interest rates 75 basis points (0.75%), and is likely only raising 50 basis points (0.5%). The looming threat of a 75 bps hike will likely continue fears of market conditions until the FED says otherwise, but for now, the future expectations from the FED are transparent. What do you expect to happen at the next FOMC meeting? Let us know on the Unusual Whales Discord community or @ us on Twitter. Also, feel free to DM me @falcon_fintwit with any questions you may have.
Unusual Whales does not confirm the information's truthfulness or accuracy of the associated references, data, and cannot verify any of the information. Any content on this site or related pages are not intended to provide legal, tax, investment or insurance advice. Unusual Whales Inc. is not registered as a securities broker-dealer or an investment adviser with the U.S. Securities and Exchange Commission, the Financial Industry Regulatory Authority (“FINRA”) or any state securities regulatory authority. Nothing on Unusual Whales should be construed as an offer to sell, a solicitation of an offer to buy, or a recommendation for any security by Unusual Whales or any third party. Options, investing, trading is risky, and losses are more expected than profits. Please do own research before investing. Please only subscribe after reading our full terms and understanding options and the market, and the inherent risks of trading. It is highly recommended not to trade on this, or any, information from Unusual Whales. Markets are risky, and you will likely lose some or all of your capital. Please check our terms for full details.
Any content on this site or related pages are not intended to provide legal, tax, investment or insurance advice. Unusual Whales Inc. is not registered as a securities broker-dealer or an investment adviser with the U.S. Securities and Exchange Commission, the Financial Industry Regulatory Authority (“FINRA”) or any state securities regulatory authority. Nothing on Unusual Whales should be construed as an offer to sell, a solicitation of an offer to buy, or a recommendation for any security by Unusual Whales or any third party. Certain investment planning tools available on Unusual Whales may provide general investment education based on your input. You are solely responsible for determining whether any investment, investment strategy, security or related transaction is appropriate for you based on your personal investment objectives, financial circumstances and risk tolerance. You should consult your legal or tax professional regarding your specific situation. See terms for more information.