If you’ve been around investing for a while, you’ve probably heard the term “September Selloff” thrown around a few times in conversation. We wanted to look at the historical returns for the month of September and see if there was anything notable, but also wanted to examine if implied volatilities on SPX contracts start bracing for a September Selloff before it happens.
Blood Red: Why September Notoriously Hurts
10/7/2021
AD_SHOULD_BE_HERE
The assumption is that, historically, pullbacks have happened in September, but is that true? Let’s find out.
Disclaimer:
As always, none of this is financial advice in any way, shape or form, and any suggestions herein referencing a strategy are for the sake of the research, and not financial advice. No items or data contained within should be interpreted as trade signals in any way, shape, or form. As with all research on the market, current and past trends do not predict or reflect future prices, but may be insightful for future movements, so do your research before you make an investment decision.
What is the “September Selloff”?
The September Selloff is generally accepted as being a true occurrence in the market, since historically, we have seen big downward movements happening in September. Why is that?
AD_SHOULD_BE_HERE
In previous years, we have seen September movements being indicative of a stronger downward trend, such as in 2001 with the dotcom boom.
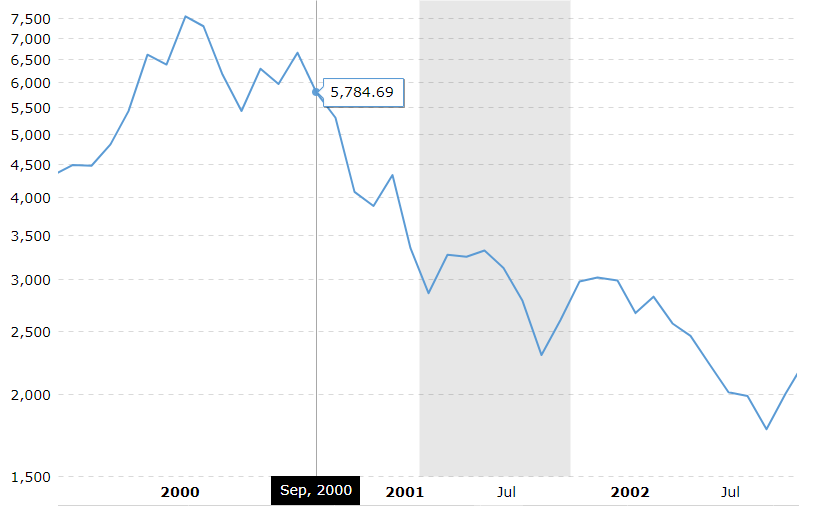
We can see that September of 2000 started the NASDAQ selloff in the dotcom boom. Though the dotcom boom was mainly felt within the NASDAQ (NDX), it was a big enough event that it affected markets on a worldwide level, causing billions of dollars in losses through the 2 or so years it fell.
AD_SHOULD_BE_HERE
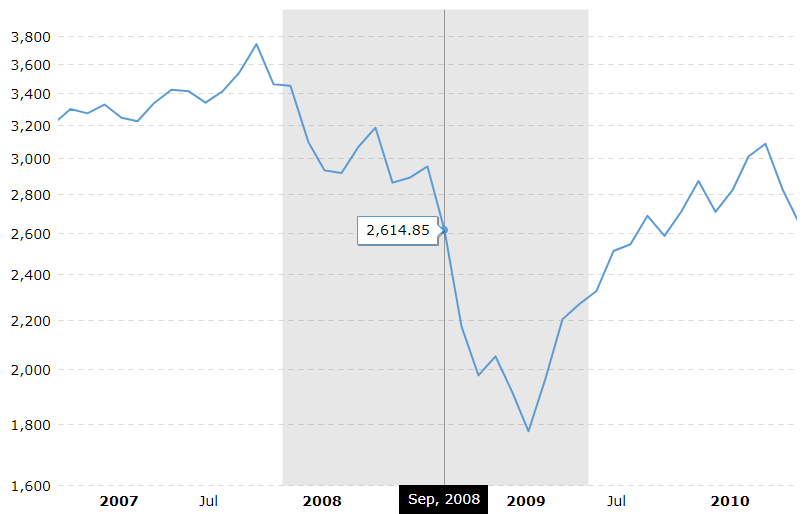
Another case where September starts a trend of a further selloff is in the late 2008 financial crisis involving worthless mortgage backed securities (MBS), collateralized debt obligations (CDO), credit default swaps (CDS), and other unscrupulous investment strategies by big banks, most notably the Lehman Brothers. This was the biggest continuous plunge of indexes in a crash (September 08 - Feb 09), and also portrayed billions in losses and the temporary halt of the American economy.
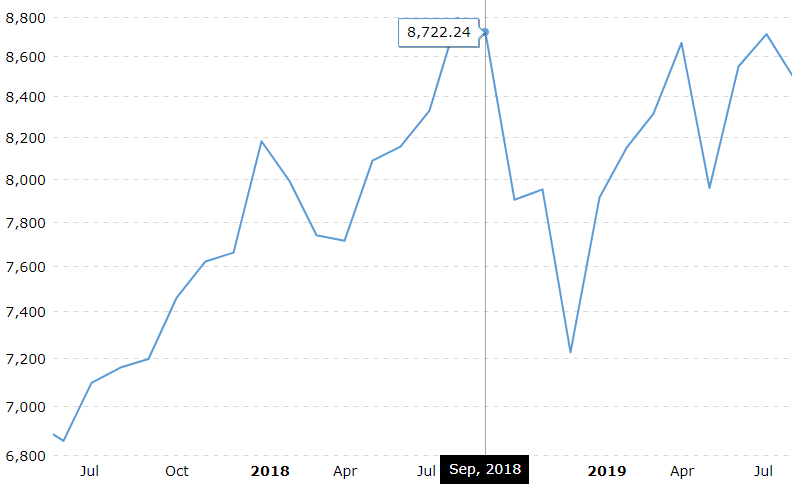
There are other examples that don’t result in major financial crises, for those who want something more light-hearted than an economic collapse and utter turmoil as an indicator.
In 2018, we saw a minor pullback in the NDX, from 3200 to ~2800, where the market promptly recovered previous highs.
AD_SHOULD_BE_HERE
With these figures portraying September as being large selloff months, what does that tell us about September? Should investors be timid with long positions?
Well, it’s not exactly transparent, unfortunately. There are many mechanisms at play for why September is historically a red month, with explanations ranging from kids returning to school so individual investors want to have money to send their kids to school (college can get expensive very quickly), seasonal rebalancing, mutual funds cashing in holdings for tax purposes, or even pure investor psychology (“stocks fall because they have before so I will sell September 1st” multiplied by a million). Heck, there is even speculation that these months return negative because they have the two shortest months of trading sessions.
“2019. There are exactly 252 trading days in 2019. February has the fewest (19), and October the most (23), with an average of 21 per month, or 63 per quarter. Out of a possible 365 days, 104 days are weekend days (Saturday and Sunday) when the stock exchanges are closed.” - Wikipedia, “Trading day”
Unfortunately, none of these give a concrete story as to why September Selloffs happen in the first place, so speculators gonna’ speculate. Let’s look at the numbers.
AD_SHOULD_BE_HERE
The numbers, Falcon, what do they mean?
Let’s start by looking at the historical returns per day, month, and year.

These 3 graphs represent the movements of the NDX since the beginning of 2000, showing the true ranges of returns over time. Most notable in Monthly Returns, we can see a trend line with most of the “weight” being above 0, which is a beautiful sight to see. However, days, months, and years show that a bear case will typically produce the fastest directional movement on each of the 3 charts. Most notable for the daily, monthly, and yearly in 2008’s Great Recession, and for the daily and monthly in 2020. However, looking at the monthly returns around the year 2000 shows how devastating the dotcom crash was to the NASDAQ.
Something fascinating to note is that the biggest COVID-19 crash day was an over 10% downward movement, higher than we saw in 2001’s dotcom boom or in the 2008 crash.
AD_SHOULD_BE_HERE
This is all fine and dandy, but what about the bread and butter, average returns per month?
September is a historical sell off month.
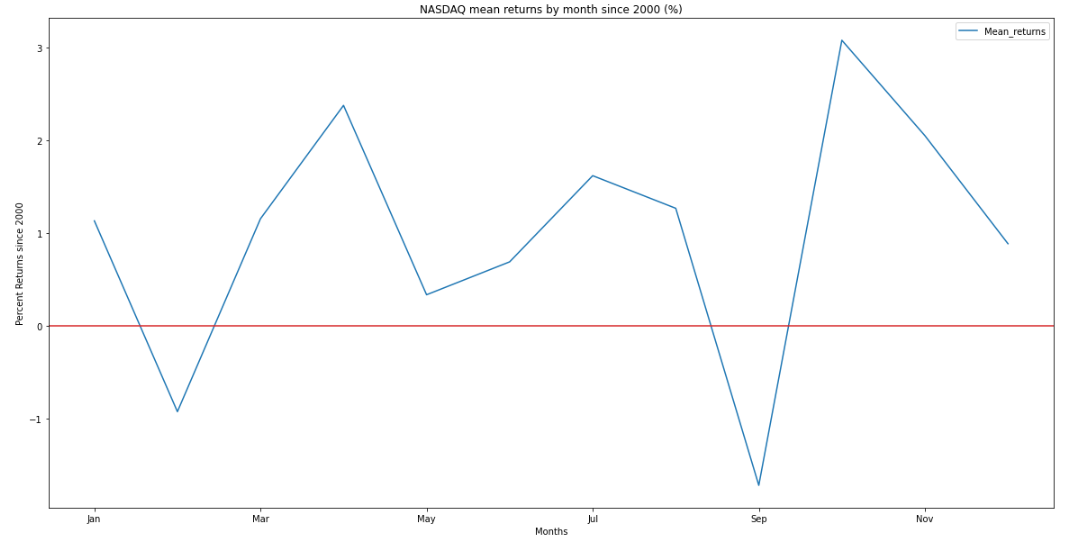
The bad news is that September is a relative low for the market, at least in the past 20 years, so there is some investor psychology at play here when “September Selloff” is mentioned. The good news is that, yes, September typically is a red month, so nothing happening in September 2021 is too “out of the normal” as far as price action goes.
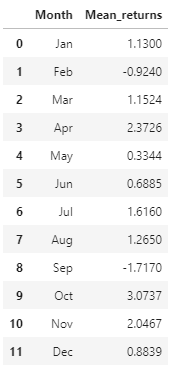
While September produces an average of a ~1.71% drop in the NDX, there are other months that have produced extremely well, being October and April, where the NDX rose ~3.07% and ~2.37% on average, respectively. Some of this movement in April can be attributed to COVID-19’s bounce back, but monthly returns are not affected much by the movement, so it’s safe to assume 2020’s April run does not need to be excluded from the data.
AD_SHOULD_BE_HERE
If you had experienced a hefty drop in September and it did some damage to your wallet, the statistics show to hold through, as October, November, and December returned ~6% from a September bottom.
What can the Implied Volatilities of QQQ contracts tell us about September?
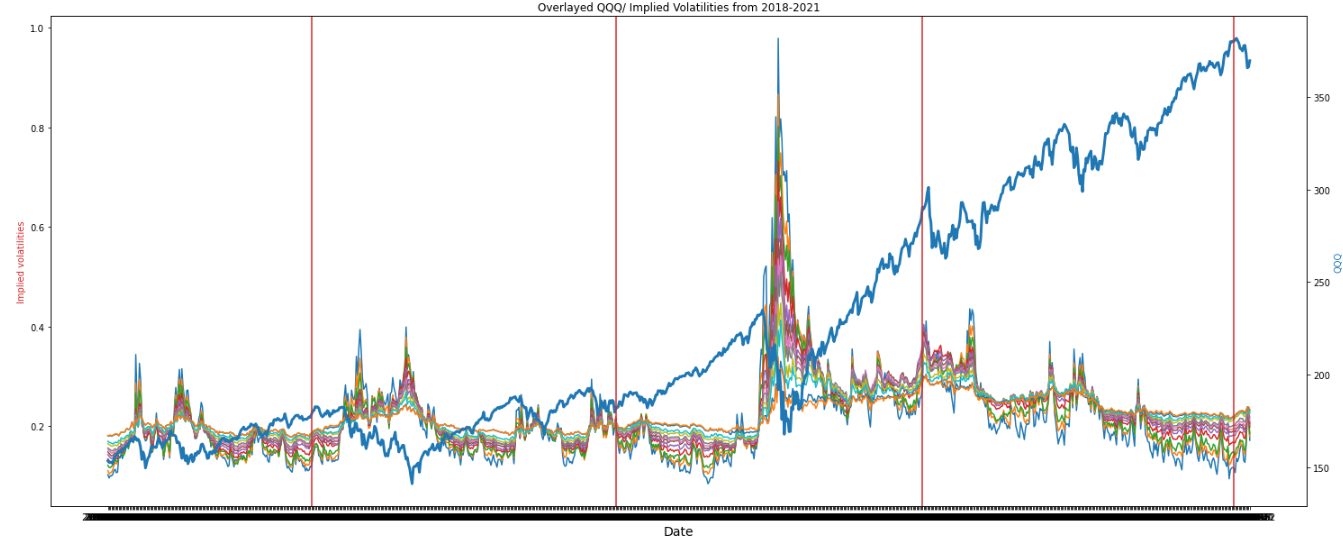
Implied Volatility, or IV, is essentially the market's interpretation of the likelihood of changes given the underlying security’s price. Typically, a low implied volatility signals future potential bullish movement, while high implied volatility would show future potential bearish movement, though this isn’t always the case.
Looking at the chart below, we can see some areas where implied volatility rises alongside the underlying share price rising, especially in September 2020, the third red line. Implied Volatility rising alongside share price is considered an extremely bearish sentiment, and is a typical warning sign for a pullback.
AD_SHOULD_BE_HERE
What about the individual Septembers? Does IV rise into each?
Before we look at that question, we need to examine a key component of how implied volatility works.
Implied Volatilities can tell a lot about the underlying and what the market is pricing in, so naturally there might be some form of correlation between rising IV’s and prices of indexes.
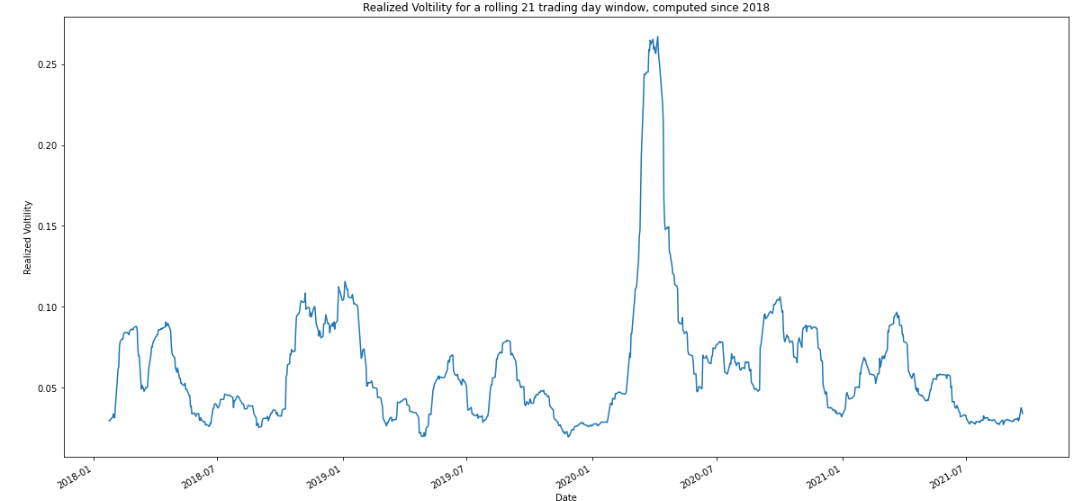
I examined the realized volatility on a 21 day monthly window (average number of trading sessions in a month) paired against implied volatilities, and found little evidence to suggest that movements were priced in. When realized volatility (RV) is greater than implied volatility, the options contracts are underpriced. Normally, the market functions with IV > RV, with the pricing of contracts being considered “overpriced”, by definition. When IV > RV, market makers benefit from these overvalued contracts by writing (selling for premium) contracts, which has historically been the case.
AD_SHOULD_BE_HERE
The closest RV > IV movement was in the 2020 Covid crash, but even then we didn’t see it come close.
The market makers win this round, those sneaky devils.
I like to move it move it (tracking IV movement in Septembers)
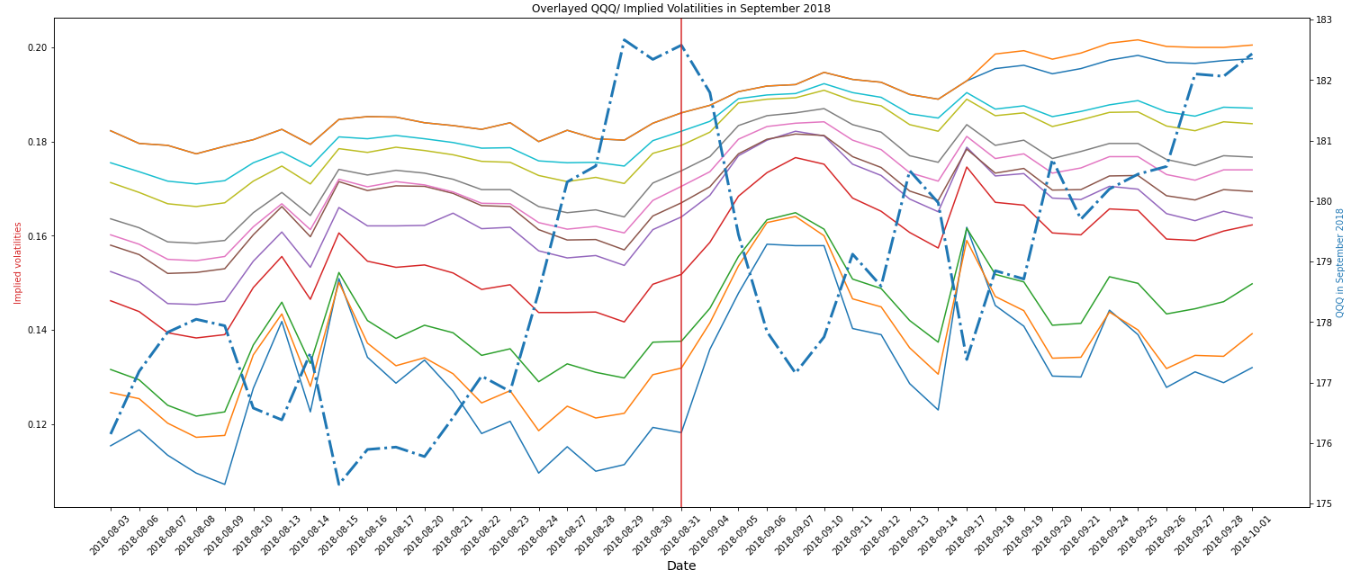
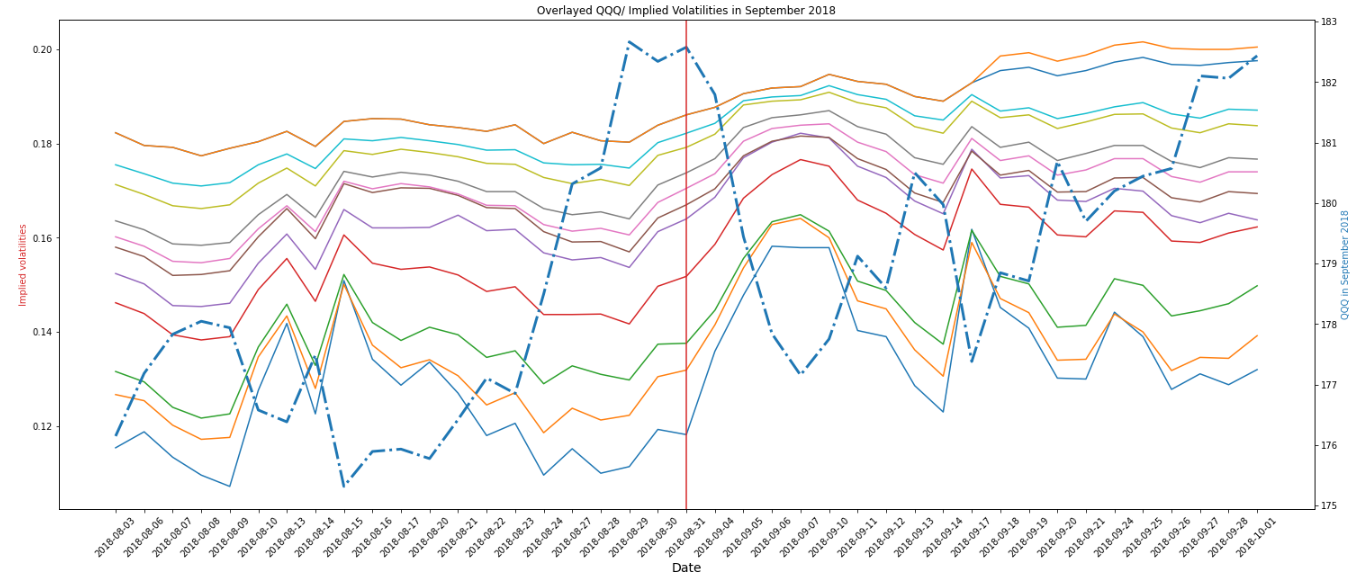
2018
Let’s start by taking a look at September 2018, and the month leading up to it. Are we seeing any unusual movement of implied volatilities? Not particularly, but sure as the sun is shining, we see a selloff. IV’s peaked around the bottom of the correction, which is normal market mechanics, so nothing to be seen in 2018.
AD_SHOULD_BE_HERE
2019
2019 was one of the rare outliers regarding a selloff, however, at the end of the month, the QQQ had only achieved marginal gains. The tightness of the IV’s here is interesting to note given the amount of chop in the market leading into September. In that 2 month spread, the QQQ only achieved a roughly 5 point move without really picking a direction. There was no truly unusual movement heading into the month.
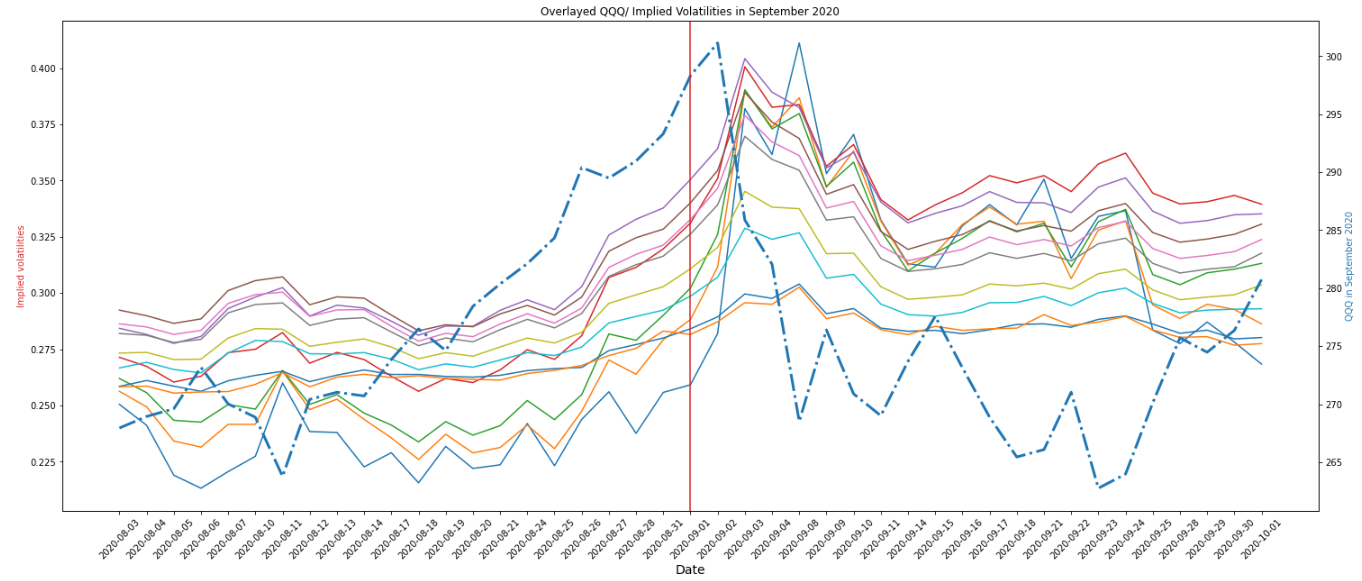
2020
Out of any of the Septembers in the analysis, September 2020 stuck out like a sore thumb. IV’s rose rapidly up to the September 2nd sell off date, which was a 10% correction from top to bottom. IV’s really started taking off in late August, around the 25th, and continued to rocket through September 3rd. This movement is a huge red flag, and should be hedged accordingly.
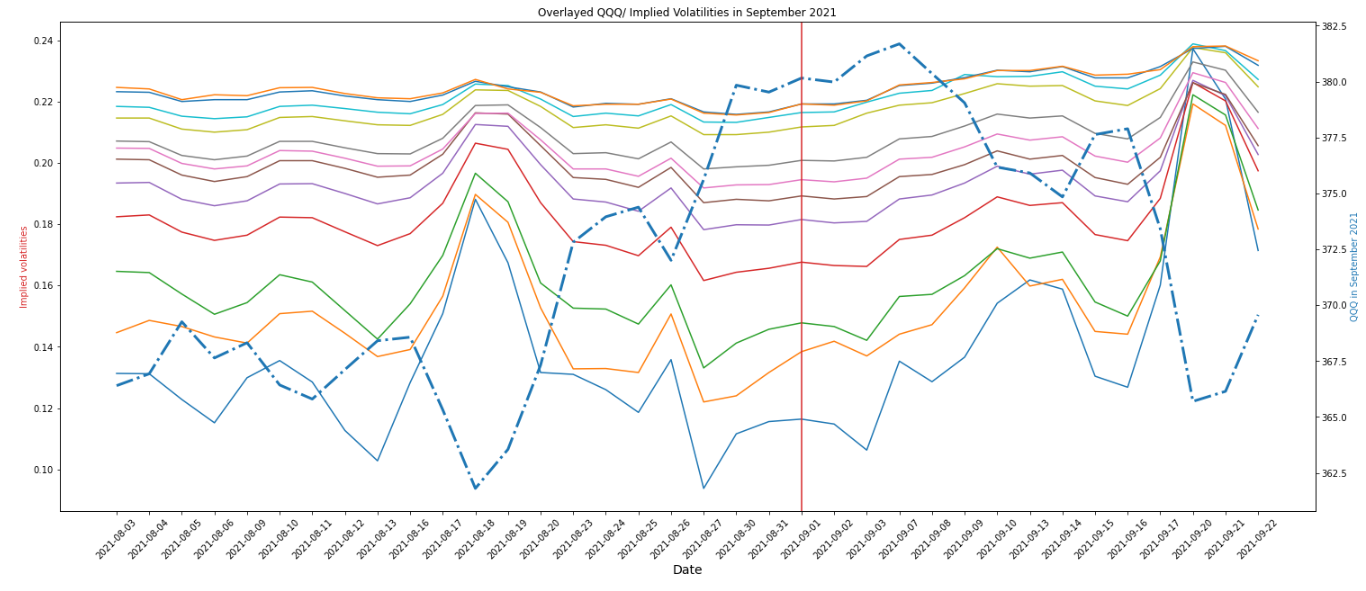
2021: Do you remember the 21st night of September?
The runup into September 2021 had minor movement in implied volatilities leading into the start of the month. For a period of ~8 sessions we saw IV rise alongside the share price, acting as a minor signal for a pullback. Part of this could have been speculatory given FOMC meetings later in the month on the 21st and 22nd, but we see the movement heading into the FOMC meeting as the index experienced a minor correction, so the movement earlier in the month was most likely not attributed towards that.
AD_SHOULD_BE_HERE
The evidence is rather small, but it’s not small enough to dismiss entirely.
What should September mean to me?
The history of the “September Selloff” shows that it is the month that will return the most negative amount for the NDX, -1.71% on average. We saw 3/4 Septembers resulting in corrections, with September of 2020 being a 10% movement. The trend is there, and now we know what to look for.
Regarding Implied Volatilities on options contracts, we should be wary if we see implied volatilities rising alongside share price. Investors should approach September with hedging for downside movements in mind, and be ready to adjust portfolios if something happens.
AD_SHOULD_BE_HERE
A very special thanks to the NASDAQ for providing the data.
DM me on Twitter @falcon_fintwit if you have suggestions for further research, or if you have any questions about methods. I would love to hear them!
For further information on unusual options flow, and more market based research, visit unusualwhales.com
AD_SHOULD_BE_HERE
DOJ and FBI have concluded that Jeffery Epstein had no "client list," and committed suicide
7/7/2025 1:31 AMTariffs return to April rates on August 1 without deals, Bessent said
7/7/2025 12:47 AMUS Treasury Secretary Bessent has said: 100 smaller countries will get set tariff rate, many never even contacted us
7/7/2025 12:45 AMThe US is to impose 10% tariffs on around 100 countries, including those in trade negotiations
7/7/2025 12:35 AM
Stay Updated
Subscribe to our newsletter for the latest financial insights and news.
Unusual Whales does not confirm the information's truthfulness or accuracy of the associated references, data, and cannot verify any of the information. Any content on this site or related pages are not intended to provide legal, tax, investment or insurance advice. Unusual Whales Inc. is not registered as a securities broker-dealer or an investment adviser with the U.S. Securities and Exchange Commission, the Financial Industry Regulatory Authority (“FINRA”) or any state securities regulatory authority. Nothing on Unusual Whales should be construed as an offer to sell, a solicitation of an offer to buy, or a recommendation for any security by Unusual Whales or any third party. Options, investing, trading is risky, and losses are more expected than profits. Please do own research before investing. Please only subscribe after reading our full terms and understanding options and the market, and the inherent risks of trading. It is highly recommended not to trade on this, or any, information from Unusual Whales. Markets are risky, and you will likely lose some or all of your capital. Please check our terms for full details.
Any content on this site or related pages are not intended to provide legal, tax, investment or insurance advice. Unusual Whales Inc. is not registered as a securities broker-dealer or an investment adviser with the U.S. Securities and Exchange Commission, the Financial Industry Regulatory Authority (“FINRA”) or any state securities regulatory authority. Nothing on Unusual Whales should be construed as an offer to sell, a solicitation of an offer to buy, or a recommendation for any security by Unusual Whales or any third party. Certain investment planning tools available on Unusual Whales may provide general investment education based on your input. You are solely responsible for determining whether any investment, investment strategy, security or related transaction is appropriate for you based on your personal investment objectives, financial circumstances and risk tolerance. You should consult your legal or tax professional regarding your specific situation. See terms for more information.